Visualization of Results
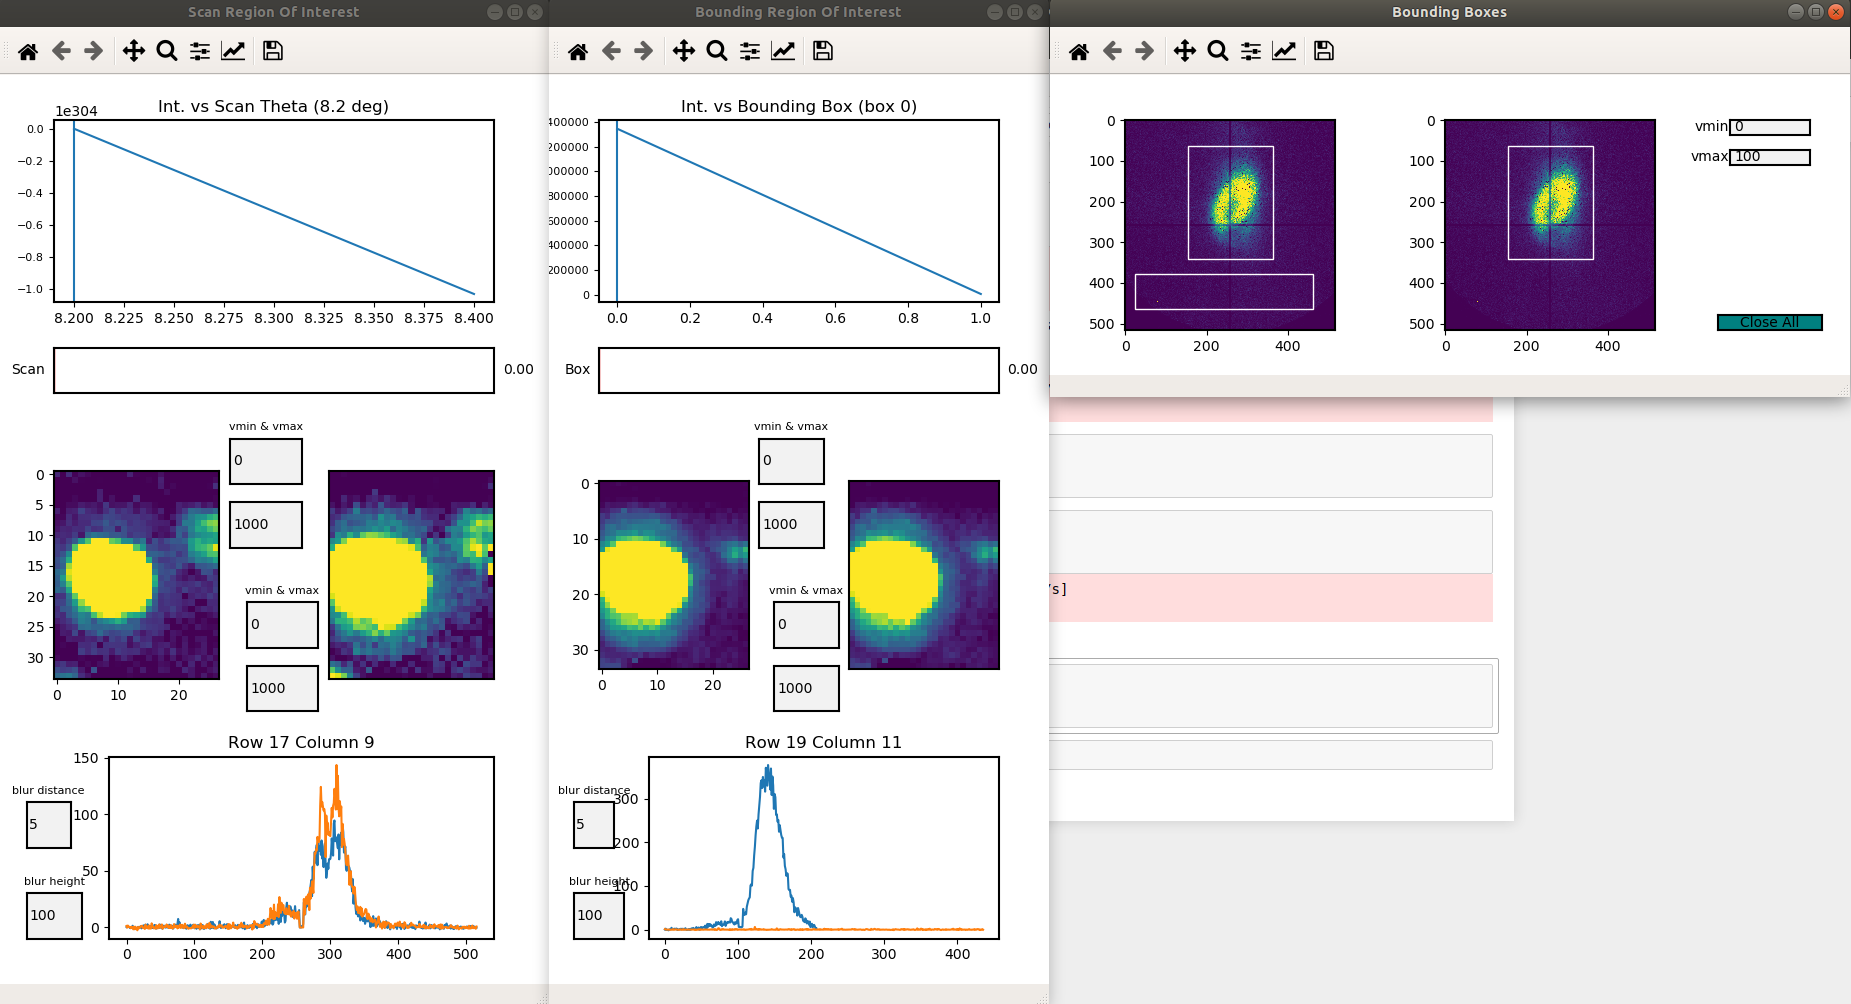
Region of Interest Viewer
This will bring up the default Region Of Interest viewer, once the test_fs.roi_results have been calculated.
test_fs.roi_viewer()
Warning
Please use the close all box to close all windows. If not the program may keep cached data
Note
Median Blur Height will be only be enabled for a median_blur_algorithm=’selective’
Note
User can move sliders as well as click on maps to show intensity values/scan values
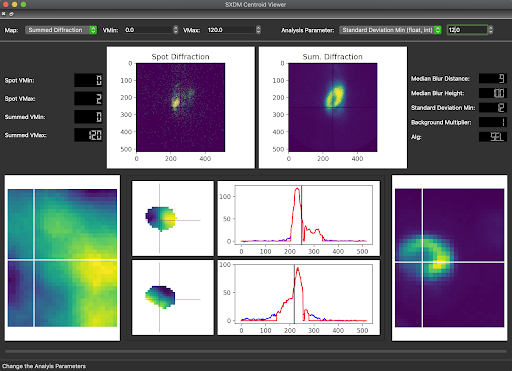
Centroid Analysis Viewer
This will bring up the default Region Of Interest viewer, once the test_fs.centroid_results have been calculated.
test_fs.centroid_viewer()
Note
Median Blur Height will be only be enabled for a median_blur_algorithm=’selective’
Note
User can click on maps to display how the program is interpreting pixel data.
Return Raw Centroid Map Values
Takes the test_fs.results and a User defined map_type and returns either the centroid data or the ROI data for the
test_fs.resutls variable.
centroid_roi_map(results, map_type)
results (nd.array) - the test_fs.results value
map_type - acceptable values - full_roi, chi_centroid, ttheta_centroid
Make New Bound For Centroid Maps
The centroid maps are in values associated with their centroid position of the .tif image dimensions (usually 516, 516). To change what the bound/values are for the centroid values the user can set values for user_map and new_bounds to rebound the centroid maps.
maps_correct(user_map, new_bounds)
user_map - the output of the centroid_roi_map() function
new_bounds - np.linspace(lowerbound, higherbound, dim of image)
Errors
The main visual error will be the Psyduck error. This occurs when the program cannot properly load the corresponding data for a given plot. Psyduck is confused and so is everyone else.